What drives the world’s changing urban geographies?
David Satterthwaite discusses how evolving economies and new technologies have changed the shape of urban centres.


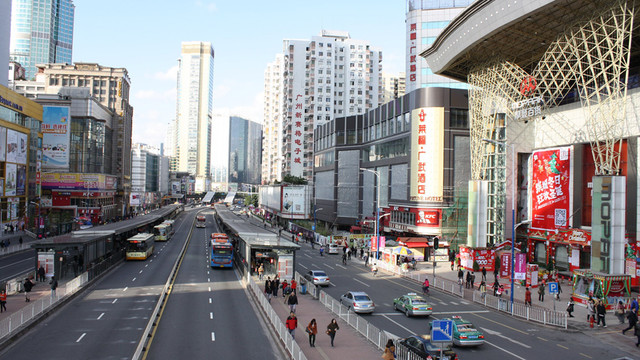
Urban geographies develop and change largely on the basis of where jobs are created and demand is high (Photo: Shankar S, via Flickr, CC BY 2.0)
In this blog, we look at what drives changes in the spatial distribution of urban populations; the next blog will examine what influences urban change (including climate change); the one that follows will consider the influences on particular cities’ development trajectories.
How urban concentrations evolve
Changing urban geographies are driven mostly by where investments go, jobs are created, and demand is concentrated. What we see on maps of the world’s large cities is where capital has been invested and where large labour markets have developed. We see the highest provision of accommodation (however bad) and the greatest number of people who need (but often do not get) access to public services.
The cities on the map also show where demand is concentrated – where there is most household and enterprise expenditure on goods and services. In part, this is a map of national capitals in relatively large population nations (half the world’s national capitals had over a million inhabitants in 2020).
But we have very little data on how cities function. Urban population statistics can show us where the largest cities are and which urban centres grow rapidly (or grow slowly, stop growing or shrink). So they tell us where people concentrate. They can also tell us where they are moving from or to. But they do not tell us why.

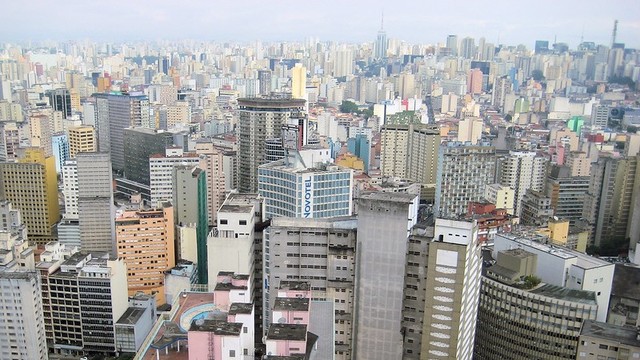
In 2015, there were 1,039 cities with a population of more than 500,000 people. Track how this has changed since 1800 in our cities data visual (Image: IIED/Kiln)
Urban population statistics and global maps of large cities also tell us nothing about the very large economic, technological, social, political, environmental and demographic changes that have underpinned or influenced urban development.
These changes include not only the growth in the world’s population but also how many times the world’s economy has multiplied and the shift in economic activities and employment structures from agriculture to industry and services (and within services to information production and exchange). These are what underpinned rapid urbanisation and changes in the spatial distribution of urban populations.
How economic change influences urban centres
Each urban centre is heavily influenced by the jobs/wages /incomes/livelihoods that economic change generates (or removes), and the associated changes in consumption demands and expenditure. And it is shaped by local government.
Of course, this includes the scale and scope of government provision for the infrastructure and public services that are important for attracting investment, reducing health risks and meeting housing needs.
Rapid urbanisation over many decades brought extraordinary changes to the homes, lives, livelihoods, incomes and consumption of most urban dwellers in high-income and some middle-income nations. It also brought extraordinary changes in the roles and responsibilities of urban (metropolitan, city, municipal) governments. It changed the funding required to meet these responsibilities and take the action needed to manage and govern them.
This often had to be achieved despite constant pressure to keep down public expenditures. It had to meet demands from citizens and civil society – for infrastructure, for public health, for schools, for security. This came to play a key role in changing urban geographies as well-governed cities attracted new investment.
But most rapid urban growth is occurring in cities in low- and many middle-income nations without sufficient infrastructure, services and city governance.
City governments are faced with extraordinary changes in the population and the economy but with little capacity to manage and govern. This has dire consequences for much of their population living in crowded and poorly built homes in informal settlements, lacking public infrastructure and services such as health care systems and piped water supplies and of other public health measures needed in each district.
As noted in the previous blog, the urgency is now all the greater to help protect people from COVID-19.
The influence of new technologies
Different age groups have different perspectives on the influence of new technologies; and different perspectives on what is ‘new’. I remember my first personal computer having a huge impact on my work – but for my daughter’s generation personal computers have always been a part of everyday life. The same goes for smartphones and 24-hour web access.
So for urban centres and systems, what new technologies change or influence the scale and location of production, jobs and incomes? How do they influence income levels and income distribution and thus consumption?
In 1900, a century or so into the industrial revolution, technologies that would transform consumption and mobility and reshape cities had not been invented (airplane) or yet made an impact – electricity, telephone services, the automobile and other motor vehicles (and the roads, highways, parking spaces and gas stations they need).
There were hardly any high-rise buildings. Radio, television and cinema had not been invented. Most information dissemination was through newspapers that had limited sources of information (mostly local) and limited reach. And the carbon footprints of households, cities and nations in comparison to today were tiny.
There was a 22-fold increase in fossil fuel use from 1900 to 2017; coal was the dominant fuel initially, but it came down to around a third from 1969 but – despite its very large carbon footprint – has dropped little since. There was also the need for great improvements in the quality and regularity of piped water, sewers and drains – already being acted on at scale in the 19th century in most high-income nations.
More recently, advanced information and communications technologies (ICTs) including computers (especially personal computers), geographic information systems, smartphones and the internet have had a powerful influence on the production of goods and services (and on their location).
Much of this favours new geographies of production, reflecting how transnational corporations dominate the global economy and the rapid growth of cities where they (and their demand for services) were housed. Many other cities prospered as part of regional and global supply chains (as noted by Saskia Sassen in Cities in a World Economy). China had 26 of the world’s largest cities in 2020 and most have roles in these global supply chains.
For individuals and households, ICTs provide huge possibilities for working from home, or setting up and running businesses at home; the spatial impact depends on where people work or operate from. Goods or services can be bought online from almost anywhere. Health care systems can include consultations by Skype.
Producing a journal is easy – all elements can be done in any location with internet connection: paper submission, review, acceptance, copy editing, files to publishers, printing, dissemination (most subscribers only get electronic copies for download – our journal Environment & Urbanization receives 500,000 downloads a year).
It is difficult to estimate with accuracy the spatial impact of many new technologies. But the link to economic growth that drives urbanisation and wealth inequality is clear. Assessing the spatial impacts of new technologies is easier at the point of production (such as impact on jobs and incomes from robots taking over most automobile and many other industries) or service enterprises (no drivers in autonomous cars).
Some mobile phone-based services are accessible to low-income groups – for instance for banking, health information, mapping and linking producers and consumers. For many years, the 32 national federations of slum/shack dwellers have been using ICT to gather data on informal settlements and producing digital maps and data needed to plan upgrading.
Community surveys and monitoring are now helping to identify families and individuals (PDF) within informal settlements who are vulnerable to COVID-19 and to determine who needs what assistance.
The next blog in this series will look at other drivers and influencers of urban change.
About the author