How much can the eyes in the sky really tell us about deforestation?
A recent study by the University of Edinburgh and IIED reveals the limitations of remote sensing technology to monitor the impacts of agriculture expansion on forests in Sub-Saharan Africa.

")
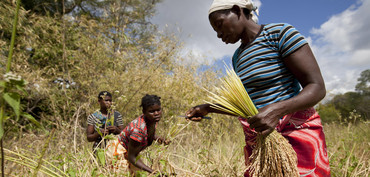
Miombo woodlands in Southeast Tanzania. But can remote sensing technologies accurately detect the woodlands (Photo: Copyright Samuel Bowers)
Africa is home to 25 per cent of the world's remaining rainforests and 17 per cent of all forests, and these provide habitat for much of the region's biodiversity. But according to the Food and Agriculture Organization of the United Nations (FAO), the continent lost around 87 million hectares of natural forests between 1990 and 2015, driven mainly by small-scale agriculture.
Many governments in Sub-Saharan Africa (SSA) have made ambitious commitments to reduce deforestation and forest degradation: seven countries as well as Nigeria's Cross River State committed to halve the loss of natural forests by 2020 and to end deforestation by 2030, while 26 countries participate in a global mechanism to 'Reduce Emissions from Deforestation and Forest Degradation (REDD+)'.
Yet these countries are facing pressures to meet tripling food demand in the next 35 years. Given agricultural production is the main driver of deforestation, balancing ambitious commitments on deforestation with rising food demands presents a major challenge.
Looking to the eyes in the sky
In response, governments are increasingly using satellite remote sensing technologies to monitor how agriculture production is eroding forests, helping to design policy responses to minimise forest and biodiversity loss while ensuring food security.
In addition, in 2014, 240 investors with US$15 trillion in assets pledged to deforestation-free supply chains. These supply chains include companies that source agriculture products from SSA (e.g. cocoa from West Africa). Those companies are also exploring ways to use remote sensing technology to monitor their supply chains and pinpoint the impact on forests.
But can current remote sensing technologies live up to the expectations of both the public and private sector to combat deforestation? According to a recent study commissioned by IIED, the answer is that it depends: these technologies have to be used with better understanding of their current limitations.
Who to believe?
A closer look at 14 of the most commonly used forest and cropland spatial data sets generated solely or partially through remote sensing technologies revealed wide disagreements. Estimates of forest area in SSA range from 4,930,000 km2 to 10,370,000 km2, a two-fold difference, while estimates of cropland area range from 830,000 km2 to 5,180,000 km2, a six-fold difference.
Lost in the woodland
In addition to big discrepancies in total area, data generated through remote sensing technologies also disagree on the spatial distribution of forest and agriculture land (see the map below).
")
In general, data was consistent where forests are dense (e.g. the rainforests of the Congo Basin and West Africa) or clearly absent (e.g. the Sahara desert and arid regions of Southwest Africa).
But 'the eyes in the sky' are not yet sharp enough to distinguish land cover classes that have similar spectral signatures (a measure of how different surfaces such as water, bare ground and vegetation reflect radiation). Woodland, a critical part of the forest ecosystems in SSA, are often confused with croplands, grassland, creating a blurry picture of where forests and croplands are.
The devil is in the definitions
Data products disagree in part due to there being no universally agreed definitions of forest and cropland. Hundreds of variations are used around the world, resulting in measurements that are often incomparable. Definitions used are not always well documented or communicated to the data's end user.
Too small to see
Moreover, the 'eyes in the sky' often overlook land covers for areas that are smaller than the resolution of the data product. In SSA, 80 per cent of all farms are smallholder farms of 2 ha or less.
Since such farms are smaller than the resolution of most existing data products they are often wrongly classified as part of a vegetation mosaic.
The implications in application
Due to these limitations, remote sensing data products may not be sufficient in assessing the agriculture drivers of deforestation.
For example, for companies to monitor how specific crops are impacting forests in their supply chain, or for governments to manage the trade-offs between meeting domestic food demand (staple food crops rather than export commodities) and forest conservation, requires a more nuanced monitoring of the impacts on forests caused by different crop types.
As things stand, accurately identifying crop types across SSA using remote sensing technology is an impossible mission.
Proceed with caution
There are ways to overcome some of these limitations. Data users can carefully examine land cover definitions and choose the most appropriate data products for their needs. Generating custom land cover datasets at national or regional spatial scales, by combining remote sensing technology with information collected locally, can also result in improved land cover maps.
Over the coming decade, advances in satellite technologies will continue to sharpen our vision from the sky with higher resolution and greater sensitivities to differences in woody biomass.
Closer to earth, crowdsourcing of data collection is helping to tackle the scarcity of data, needed to calibrate and test remote sensing data products. This data enables us to capture land use and land use changes that occur over small areas more accurately.
But, for now, our 'eyes in the sky' can only offer limited answers, and spatial information should be used with caution.
Xiaoting Hou Jones (xiaoting.hou.jones@iied.org) is a researcher in IIED's Natural Resources research group; Samuel Bowers (sam.bowers@ed.ac.uk) is a research scientist at The University of Edinburgh