Data tales – part two: the challenge of technology
Guest blogger Antarin Chakrabarty continues his tales of data discoveries made in the course of his work in the Indian state of Odisha during its ambitious slum upgrading programme.


A Google map of Cuttack, India. Despite the advanced technology behind Google maps, geographic information system (GIS) maps, connected to surveys and local knowledge, can provide even more detailed data (as can be seen below)
My previous blog looked at the generation, ownership and use of GIS (geographic information system) data underpinning the slum upgrading programme. Claims that no such data existed were not true for some cities – the problem was that it had never been used; indeed senior officials were often unaware of its existence.
A few days after my encounter at the Bhubaneswar Municipal Corporation (reported in my previous blog) and in the hope of unearthing more forgotten data, I made a visit to the Cuttack Municipal Corporation. Cuttack is the second city of the state of Odisha and home to about 263 slums spread across the dense fabric of the city.
Here I met two women, consultants of course, who were engaged in the laborious process of marking the boundaries of the slums in the city on Google Earth and saving them as KML (Keyhole Markup Language) files.
More hidden (data) treasure
Following a short conversation, I learnt that here too there was a desktop computer which contained "some data". The "some data" turned out to be another stuffed folder (though slightly smaller than Bhubaneswar's 1GB) containing a detailed geo-spatial database (boundaries, slum houses, streets, infrastructure) of 141 of Cuttack’s slums.
The database didn't cover all the slums in the city, but contained a very detailed economic survey of households, which was lacking in the Bhubaneswar database. It turns out that this valuable database was also created during the RAY (Rajiv Awas Yojana) project (PDF).
I asked them why they were spending hours tracing slum boundaries on Google Earth when such a detailed database existed in their own office. As I expected, it turned out that they did not have the necessary software to open the files and were unaware of the free and open-source software alternatives.
The process
The RAY guidelines were clear and comprehensive and sought to use the available technology of the time to prepare accurate GIS maps of slums in reasonably short time.
Both standardisation of technical processes and speed of execution are important considerations in India. Even a limited coverage government scheme has to include hundreds of thousands of households living in hundreds of slums across tens of cities. The challenge is how to make these processes adequately participatory and responsive to community needs while operating at mega scales.
For those interested in the technology used in the RAY project (PDF), geo-referenced imagery from Indian Cartosat satellites was used as a base for more detailed Differential Global Positioning System (DGPS) surveys. The DGPS points and the satellite imagery were used for digitising the slum boundaries and the footprints of each house in the slum, which were then given unique numbers.
The household surveys could be tagged to individual homes in the GIS database using these unique house numbers. The following images give a sense of the mapping process.


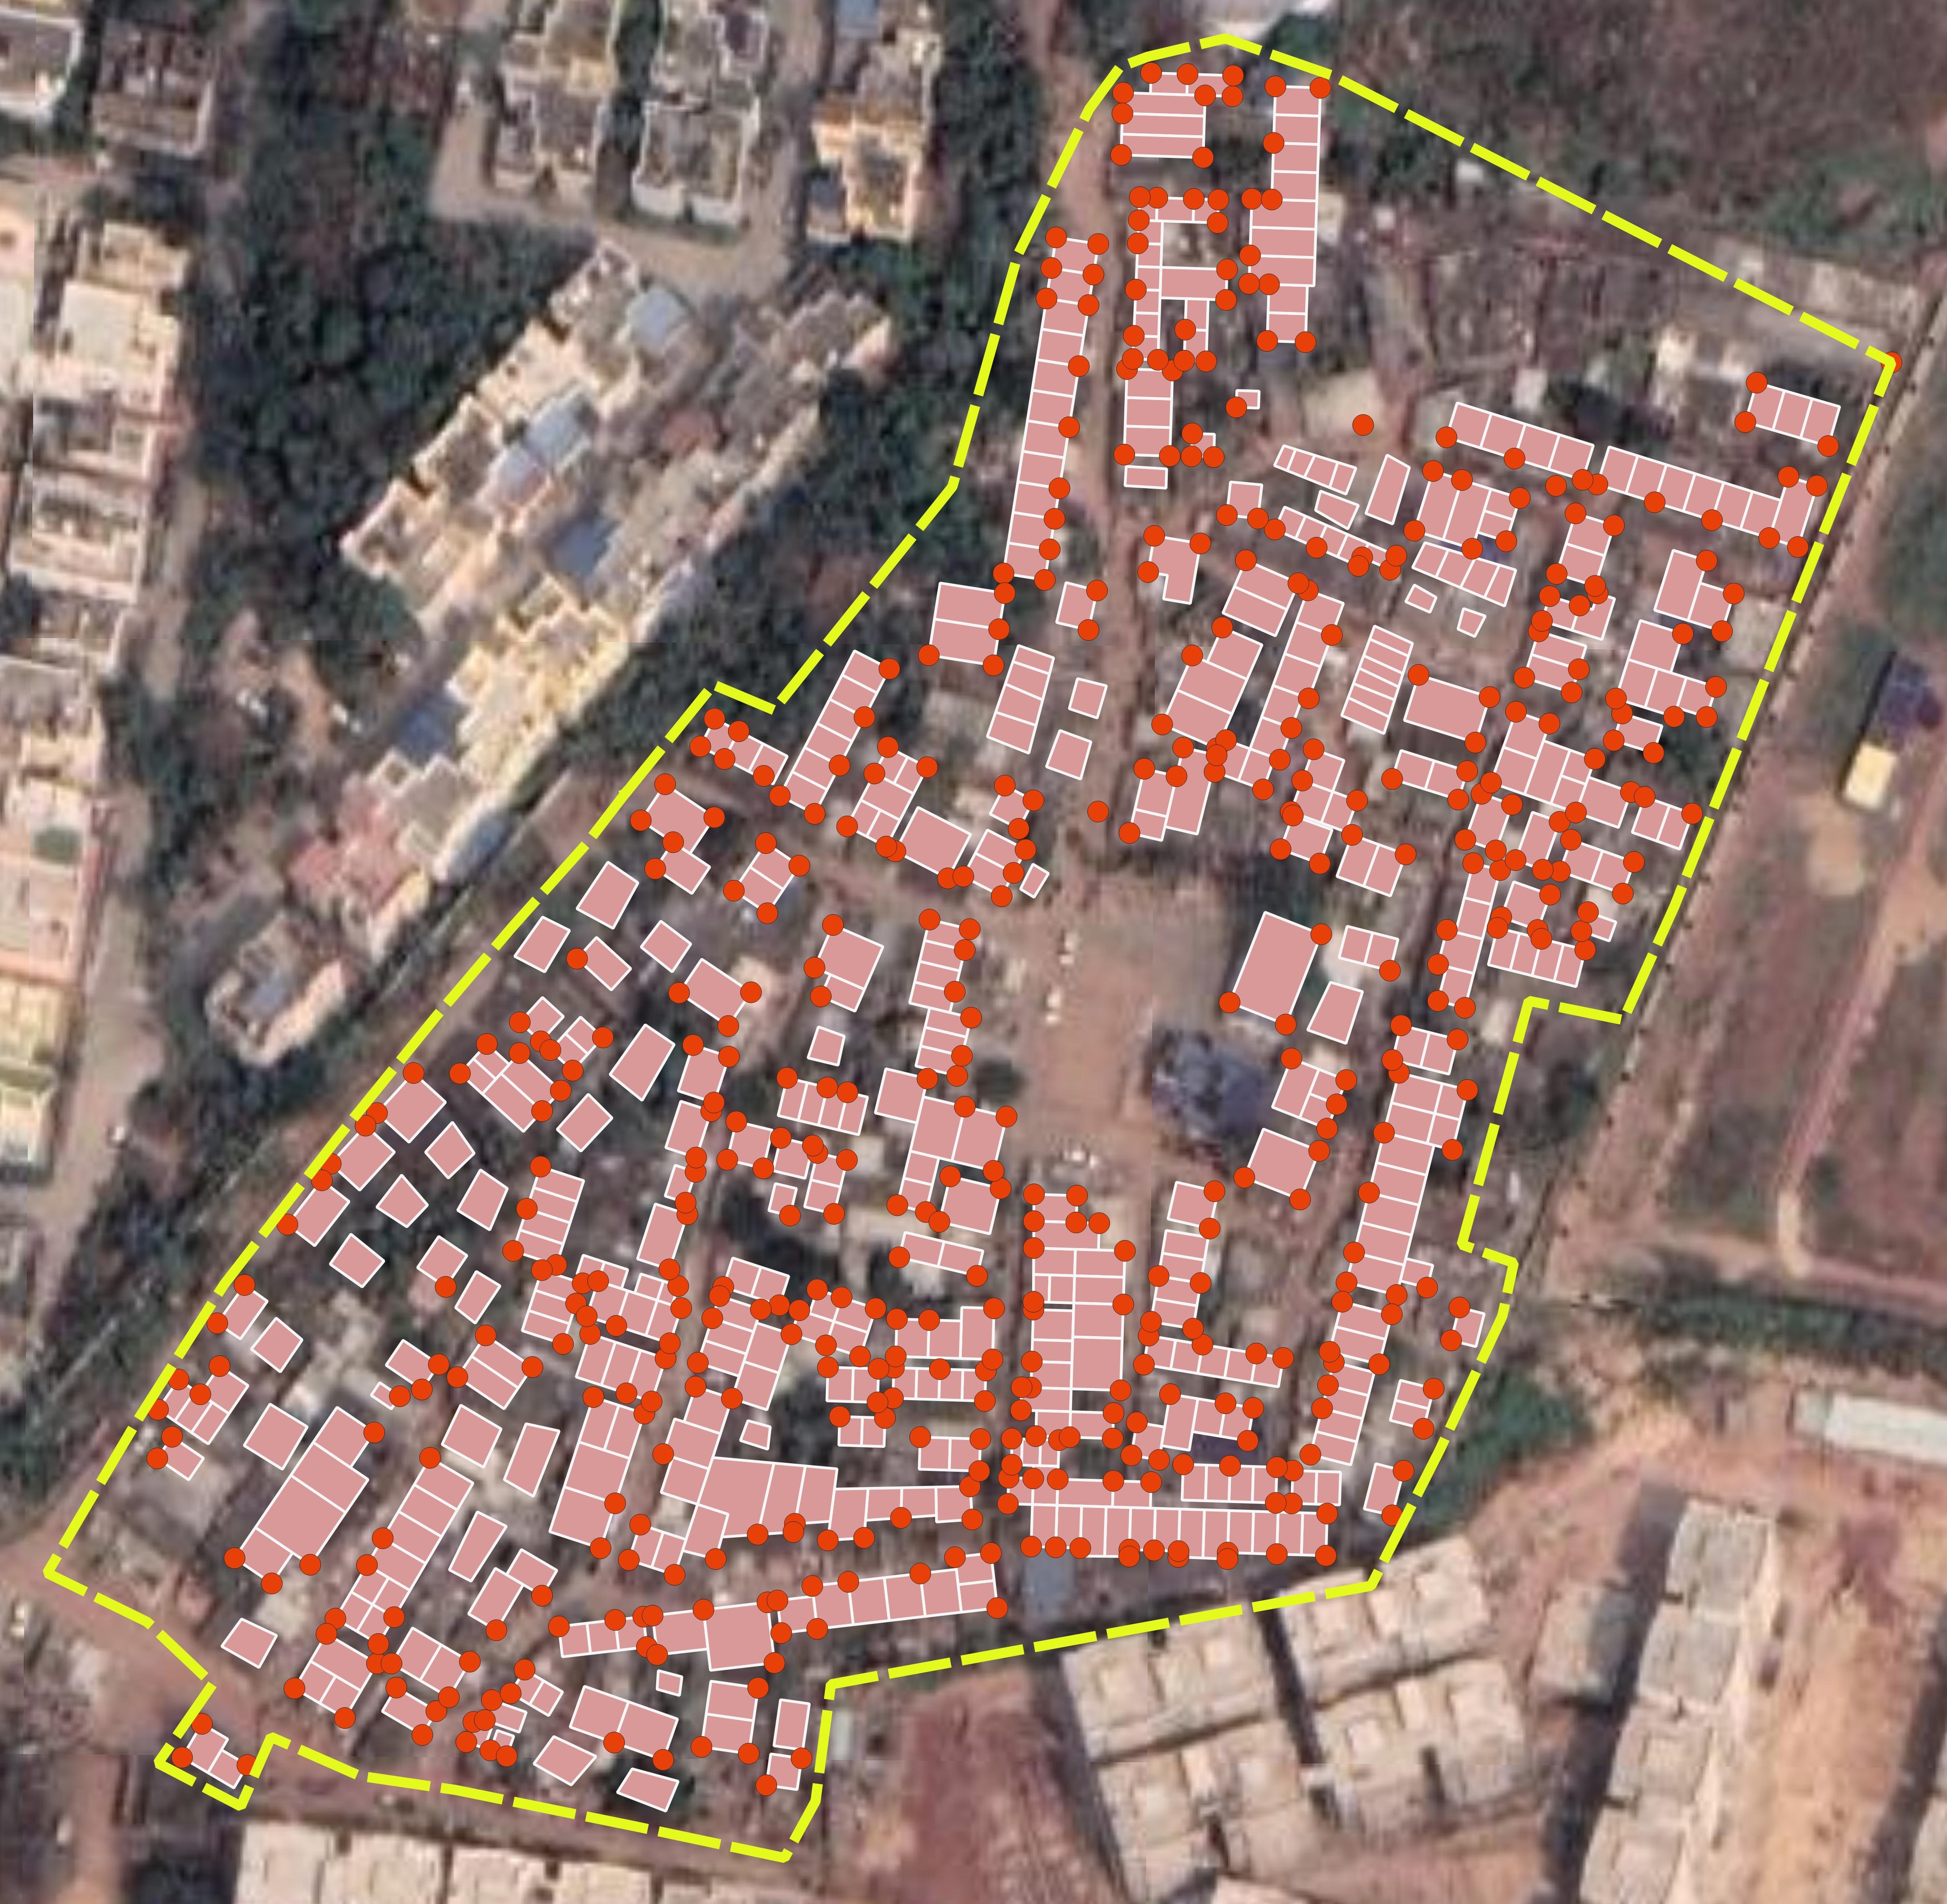
Click on the images to enlarge them and scroll through the gallery. From left to right: 1 Demarcating slum boundary on satellite imagery. 2 DGPS survey points overlayed on satellite image. 3 Building footprints digitised using satellite imagery, DGPS points and field observations as guides
While imagery of the Cartosat-2 satellite was of sufficiently high definition to discern the general morphology of the slum, demarcate its boundary and identify streets and squares, it wasn’t sharp enough to accurately mark the outlines of individual houses.
Community engagement is key
So DGPS surveys were necessary to mark the edges of structures inside the slum and these points were overlaid on the satellite imagery, acting as a guide, for digitising the walls of the structures.
The very act of undertaking the DGPS survey inside the slum – spending weeks placing the tripods along the edges of each structure and recording the measurements – clearly can’t be done without the cooperation and involvement of residents. Similarly, demarcation of the exact positions of houses (especially small and densely packed homes) could not be done (at least in those days) without this method.
But just a few years later, the Jaga Mission slum upgrading programme would replace this method with drone-based imagery, which had such extremely high resolution (almost 50 times higher than Cartosat-2) that the whole labour and time-consuming process of taking DGPS points could be eliminated.
While Jaga Mission sped up the process even more with its effective use of technology, it simultaneously increased levels of community engagement and participation to unprecedented levels. Technology, by itself therefore, is not an enemy of community participation.
Here is where the challenge of technology comes for NGOs and community organisations. I remember a paper giving an account of Mahila Milan (the federation of women’s savings groups) and local NGOs trying to get agreement on support for their proposals.
Mahila Milan’s long experience with slum mapping taught them that, as a first step, collecting comprehensive citywide information for each slum household as required by RAY was both unrealistic and undesirable. It is only when a project is approved that this is no longer unrealistic and undesirable, but a key part of supporting implementation.
It may be more accurate to say that it is undesirable if it is unrealistic. That it was not unrealistic at all was adequately clear to me based on the 2GB of detailed data that was scooped up by me in two days. I had in my possession detailed maps of 577 slums with every single structure marked and detailed household data tagged to those structures.
Using technology to make local friends
However, I could not find anywhere a single such map prepared by the NGOs despite their elaborate participatory exercise, which included training slum dwellers in the use of hand-held GPS devices to record the data, and then using available open-source software to process it.
While the choice of open-source software was commendable, it is clear to anyone familiar with the technology, that residents could only be expected to demarcate the boundary and some external features of their slum using this method. It would simply be too laborious, time consuming, and potentially exploitative to expect them to spend time producing the level of detail required inside the slum – especially when it is easily done by professional surveyors.
A much better use of members of the community would be for them to guide the surveyors with local knowledge about the geography of the settlement, the location of important features and also to correct, enrich and validate the maps prepared by them. Not only does this create a lively interaction between the slum dwellers and the consultants, but it can also create a meaningful and mutually beneficial transfer of knowledge.
This is exactly the method that was adopted in the Jaga Mission. One of the most joyous and community-engaging events during these surveys used to be flight of the toy-like quadcopter drones (more on that in future blogs). And I feel that to a certain degree this community involvement must have happened during the RAY surveys too. It is simply impossible to prepare such detailed and accurate GIS maps of slums without serious engagement with slum dwellers – whether documented or not.
How to design and position community participation activities effectively in the age of continuously-evolving technologies is definitely a challenge – but not an unsurmountable one at all as the reader will discover in part three of these data tales.
More on data tales
We invited Antarin Chakrabarty to contribute to this blog series and reflect on his experience working in Jaga Mission, the state of Odisha’s ambitious slum upgrading programme. His particular interest is how well this was served – or not served – by GIS.
- Data tales part one looks at the generation, ownership and use of GIS data to underpin the slum upgrading programme – or often the non-use
- Data tales part three reveals the (unexpected) technological prowess of the urban poor
- Data tales part four shows how the lack of relevant or accurate data on climate risk and resilience in slums could be resolved by making community-based data collection the norm.
- Data tales part five questions whether the flashy and often unnecessary ways we use computers have detracted from their primary function of reliving humans of boring, repetitive tasks.