The global geography of world cities
Various lists and indicators are used to determine which cities are deemed ‘world cities’. David Satterthwaite examines four lists of different indicators and discusses which cities come out on top.


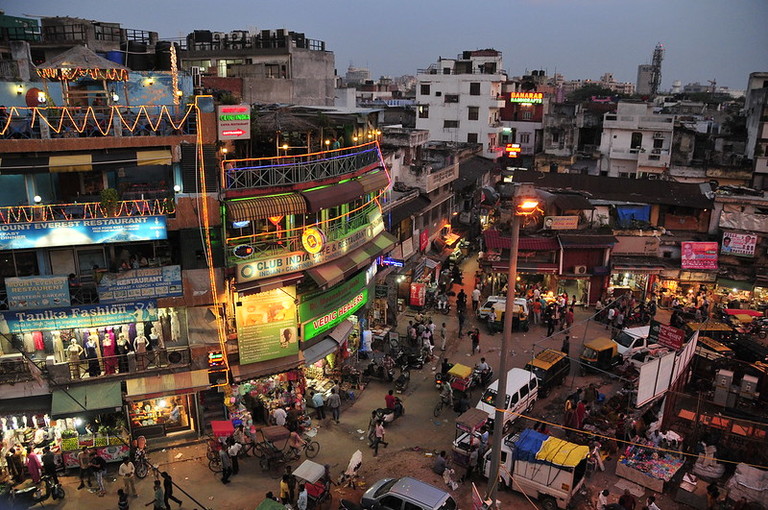
Global cities are essential to the world economy, but the playing field is still unequal. While Delhi is the world’s second largest city, it does not appear in any of the global city rankings (Photo: Philippe Renneville via Flickr, CC BY 2.0)
What are termed ‘world’ cities or ‘global’ cities command and control the world economy, and are centres for transnational corporations (TNCs). They are mostly among the world’s wealthy cities; if not, they are at least among the wealthiest in their nation.
But the cities from where TNCs produce their goods are often not wealthy. Dhaka is a clothes manufacturing hub for global brands yet TNCs do not have headquarters there. When global brands cut their businesses, it is the million or so workers in Dhaka who are laid off.
Global cities play a key role in the world economy – but the playing field is increasingly unequal. Most cities are not able to engage seriously in global or regional contests for corporate headquarters. Some may be able to attract investment in production, especially where wages are very low. But being far from major trunk transport, communications and other infrastructure prevent them from genuinely competing.
There are many lists that rank cities by indicators – such as gross domestic product (GDP), GDP per capita or housing affordability. Cities are also ranked using composite indicators measuring, for instance, business environment or quality of life (or subsets of this). Some lists relate more directly to ‘global’ or ‘world’ city economies.
Here, we look at four of these lists – cities ranked by:
- Their concentration of advanced producer services (accountancy, advertising, banking/finance, law)
- Their number of TNC headquarters and their size and economic performance
- Scores on global financial services, and
- A composite indicator including scores on business activity, human capital, information exchange, cultural experience and political engagement.
Table 1 below presents lists of the top 20 cities, ranked under these categories.
Table 1
| Rank | Advanced producer services | TNC headquarters | Global financial services | Global cities |
|---|---|---|---|---|
| 1 | New York | Beijing | New York | New York |
| 2 | London | New York | London | London |
| 3 | Paris | Tokyo | Hong Kong | Tokyo |
| 4 | Hong Kong | London | Singapore | Paris |
| 5 | Tokyo | Paris | Shanghai | Hong Kong |
| 6 | Los Angeles | San Jose | Tokyo | Chicago |
| 7 | Singapore | San Francisco | Beijing | Los Angeles |
| 8 | Frankfurt | Seoul | Dubai | Singapore |
| 9 | Milan | Hong Kong | Shenzhen | Sydney |
| 10 | Sydney | Washington, DC | Sydney | Seoul |
| 11 | Brussels | Toronto | Toronto | Brussels |
| 12 | San Francisco | Dallas | San Francisco | San Francisco |
| 13 | Washington, DC | Chicago | Los Angeles | Washington DC |
| 14 | Madrid | Zurich | Zurich | Toronto |
| 15 | Toronto | Moscow | Frankfurt | Beijing |
| 16 | Zurich | Houston | Chicago | Berlin |
| 17 | Moscow | Shanghai | Paris | Madrid |
| 18 | Mexico City | Stockholm | Boston | Vienna |
| 19 | Chicago | Munich | Melbourne | Boston |
| 20 | São Paulo | Minneapolis | Montreal | Frankfurt |
Meanwhile table 2 ranks the 20 largest and wealthiest cities. The text below provides commentary on what the tables show. But care is needed; the data for the indicators are for different years and the studies may use different city boundaries.
Table 2
| Rank | Cities with largest populations 2020 | City GDPs |
|---|---|---|
| 1 | Tokyo | Tokyo |
| 2 | Delhi | New York |
| 3 | Shanghai | London |
| 4 | São Paulo | Los Angeles |
| 5 | Ciudad de México (Mexico City) | Seoul |
| 6 | Dhaka | Paris |
| 7 | Al-Qahirah (Cairo) | Chicago |
| 8 | Beijing | Osaka-Kobe |
| 9 | Mumbai (Bombay) | San Francisco |
| 10 | Kinki M.M.A. (Osaka) | Washington, DC |
| 11 | New York-Newark | Dallas-Fort Worth |
| 12 | Karachi | Houston |
| 13 | Chongqing | Shanghai |
| 14 | Istanbul | Boston |
| 15 | Buenos Aires | Philadelphia |
| 16 | Kolkata (Calcutta) | Beijing |
| 17 | Lagos | São Paulo |
| 18 | Kinshasa | Atlanta |
| 19 | Manila | Seattle |
| 20 | Tianjin | Nagoya |
By indicator: which ‘world cities’ take the top 20 spots?
These lists show the power of the ‘old guard’: New York, Tokyo, London and Paris are top or close to the top. They also have among the largest GDPs and high (but not among the highest) GDPs per capita. All benefit from being very successful tourist cities. All but Tokyo slipped down the rankings based on population.
Hong Kong, Toronto and San Francisco score well against all four indicators; Singapore and Sydney in all but TNC headquarters. By contrast, three cities score well for TNC headquarters but are not on any of the other lists: Stockholm, Houston and Dallas.
Beijing is ranked top in TNC headquarters, seventh in global financial services and 15th in global cities; it does not make the top 20 for advanced producer services. Delhi, the world’s second largest city, does not appear in any of the global city rankings.
Most of the cities with the largest economies are in one or more of the four global cities’ top 20 rankings; the exceptions are mainly cities in the United States. Philadelphia, Atlanta and Seattle are among the 20 cities with the highest GDPs but not within the top 20 for any of the global city indicators.
Regional spread: Europe, US and Asia still dominate…
Table 3 shows the regional distribution of the 20 highest scoring cities for each of the global city indicators. No African city is on any of the lists and only one of the four lists includes cities from Latin America and the Caribbean. We may talk of a global economy but most ‘global’ cities are in Europe, North America and Asia.
Table 3
| Global cities indicators | Advanced producer services (2010) | Transnational corporations (2015) | Global financial services (2019) | Global cities (2011) |
|---|---|---|---|---|
| National capital | 10 | 9 | 6 | 10 |
| In low-income nations | – | – | – | – |
| In middle-income nations | – | 3 (2 in China) | 3 (all in China) | – |
| Africa | – | – | – | – |
| Asia | 3 | 5 | 7 | 5 |
| Europe | 8 | 6 | 4 | 7 |
| Latin America and the Caribbean | 2 | – | – | – |
| Northern America | 6 | 9 | 7 | 7 |
| Oceania | 1 | – | 2 | 1 |
Cities from low-income nations do not make any of the four lists. Only two lists have cities from middle-income countries (where 72% of the world urban population live). Both these lists have three cities each and all but one is in China. In TNC headquarters, only one city (Beijing) is not from a high-income nation – but is ranked first.
The advanced producer services ranking comes from research that identified 55 ‘world cities’ based on their concentration of offices of 46 'global' advanced producer service firms. If we extend our interest to all 55 cities covered in the research, all are substantial cities, but most are not among the world’s largest.
In 2020, only 16 of the 55 ‘world cities’ were megacities (10 million plus inhabitants). Many are of a more modest scale. For instance, 11 had less than 1.5 million inhabitants; all were in Europe. Three were German, including Düsseldorf and Frankfurt with under a million inhabitants.
Two US ‘world’ cities had relatively modest populations: San Francisco (3.3 million) and Minneapolis (2.9 million). Extending the list to 55 cities meant one was in Africa (Johannesburg) and five were in Latin America. If a country has a world city, it is usually their national capital – 27 of the 55 world cities were national capitals.
The study that ranked cities based on the number, size and economic performance of TNC headquarters in 2015 highlights the cities with high scores that had only 1-5 TNC headquarters – but where one or more of these is a very large and powerful TNC – as in the case of Fayetteville, home to 209,000 people, and Walmart’s headquarters.
…but cities from low- and middle-income countries are still absent
Extending the analysis from 20 to 50 cities does not significantly change the regional distribution. No low-income nation city features. From middle-income nations there was only Mumbai and Sao Paulo.
The data on TNC cities is also available for 2006. It shows several Chinese cities went up the rankings between 2006 and 2015: Beijing, Hong Kong, Shanghai and Shenzhen. The ranking of most cities in Western Europe and Japan dropped significantly. So too did several US cities, including Dallas, Houston and Chicago.
Most cities on table 1 are very large cities, but with some exceptions (such as Vienna and Berlin, although these were once among the world’s largest cities). Eleven are national capitals and only three are within the world’s 20 largest cities.
Will local, national and global responses to COVID-19 change these lists? Will more private investment flow to cities (and nations) with good public health policies (as they did to Surat after the public health improvements following the plague)?
More attention to more robust supply chains that benefit some cities and nations, and disadvantage others? For nations, finally a full recognition of the importance of capacitated and accountable city governments for local and global public health? Tighter controls on international population movements, especially for those in countries that still have high numbers of new infections? But how to reconcile this with tourism from the perspectives of the tourists and of the tourist-related enterprises including their reliance on low-wage labour.
The next blog in this series will examine how refugees and displaced people are contributing to urban change.
Sources for the tables
- Advanced producer services: This draws on a database on world cities and global firms developed by PJ Taylor and DRF Walker as part of their project 'World city network: data matrix construction and analysis' and are based on primary data collected by JV Beaverstock, RG Smith and PJ Taylor (ESRC project 'The geographical scope of London as a world city' (R000222050)). They constitute Data Set 6 of the Globalization and World Cities (GaWC) Research Network
- Transnational Corporations: Csomós, György (2017), 'Cities as command and control centres of the world economy: an empirical analysis, 2006-2015' Bulletin of Geography. Socio-economic Series 38(38)
- Global financial services: Global Financial Centres index 27 (PDF)
- Global cities: Global Sherpa; World’s most global cities


